Sampling techniques |
What you need to know:
| Click to change examination board: |

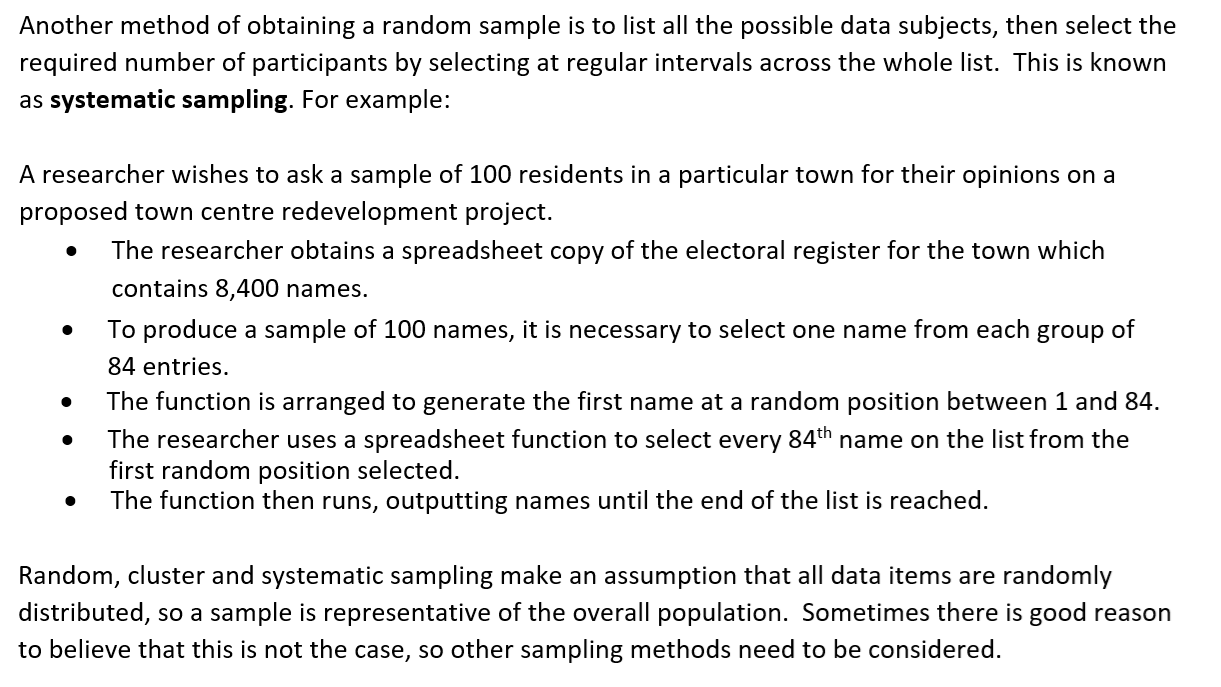
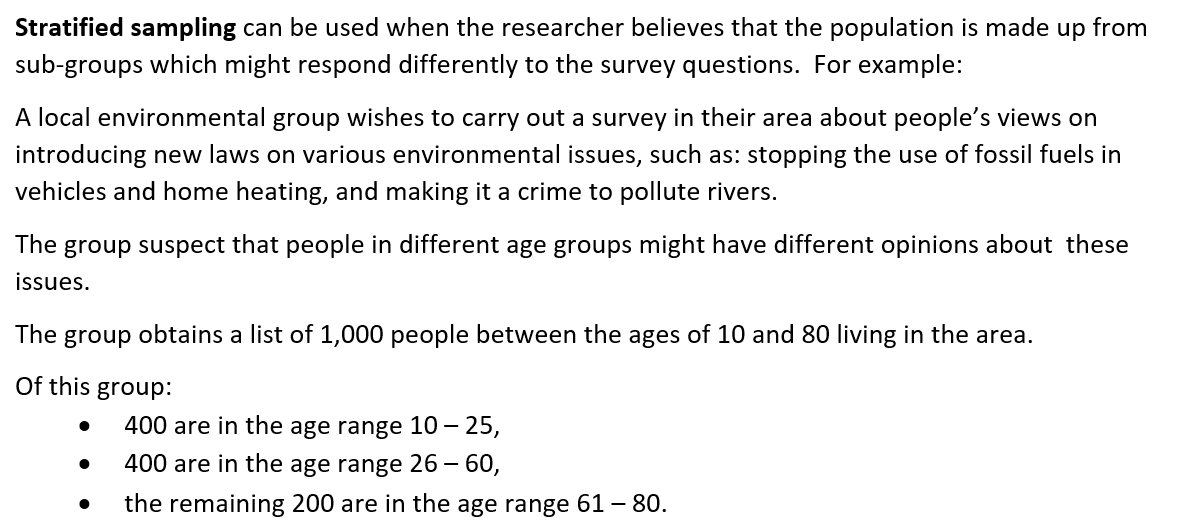
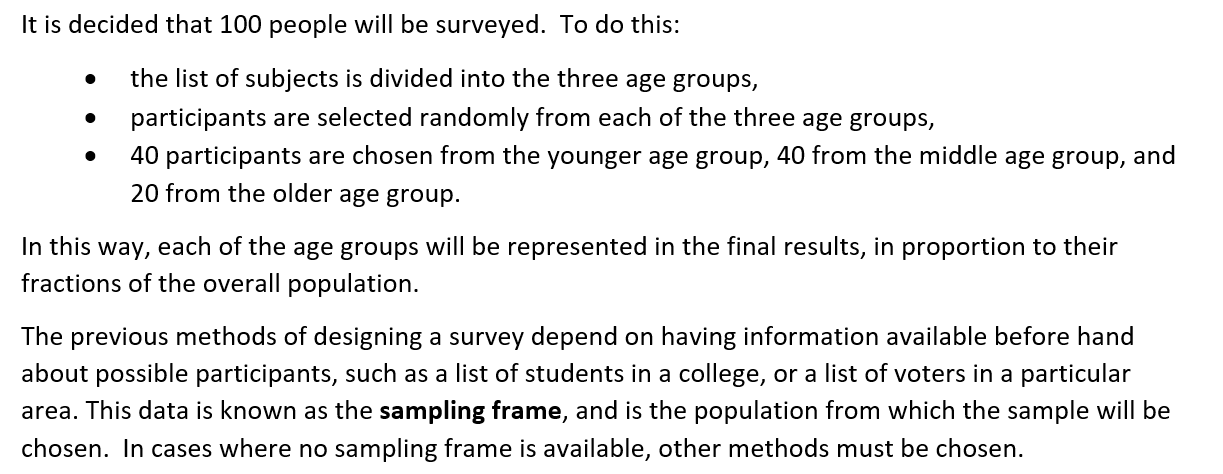
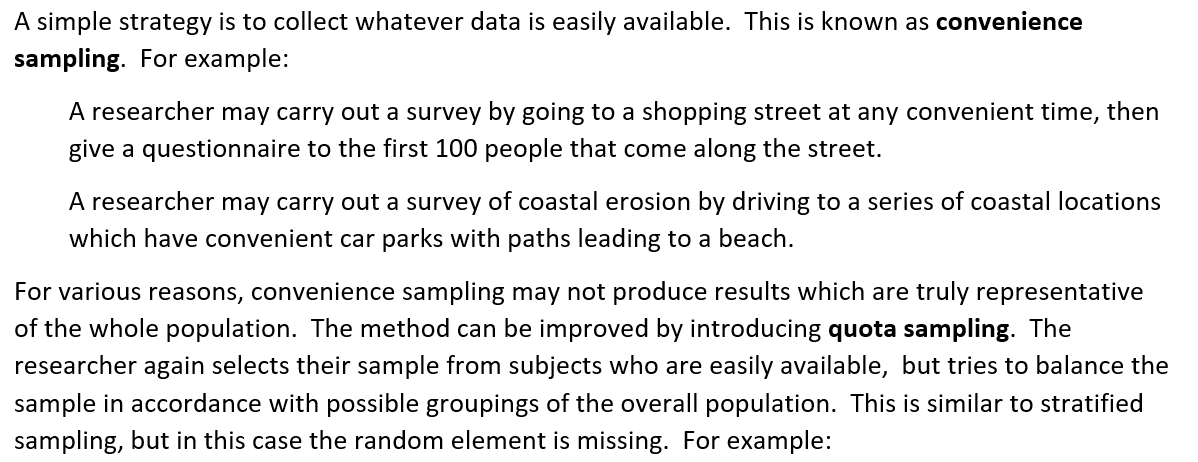


'Quarterly provisional motor vehicle traffic by vehicle type and road class, Great Britain'
from the UK Government web site. This is a spreadsheet in Open Document format which can be loaded into Microsoft Excel or other spreadsheets. The data set will be used to demonstrate a number of the statistical methods introduced during the learning sessions.
The spreadsheet file contains two pages of data, labelled TRA2503a and TRA2503b.
Open each page and adjust the column widths so that all text and numbers are visible.
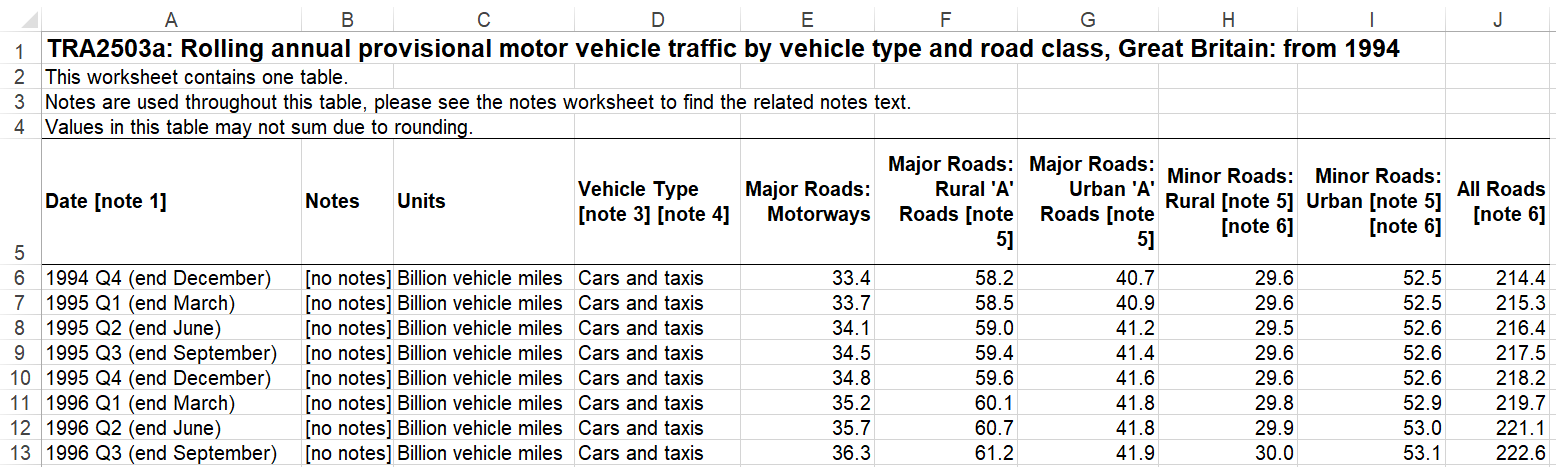
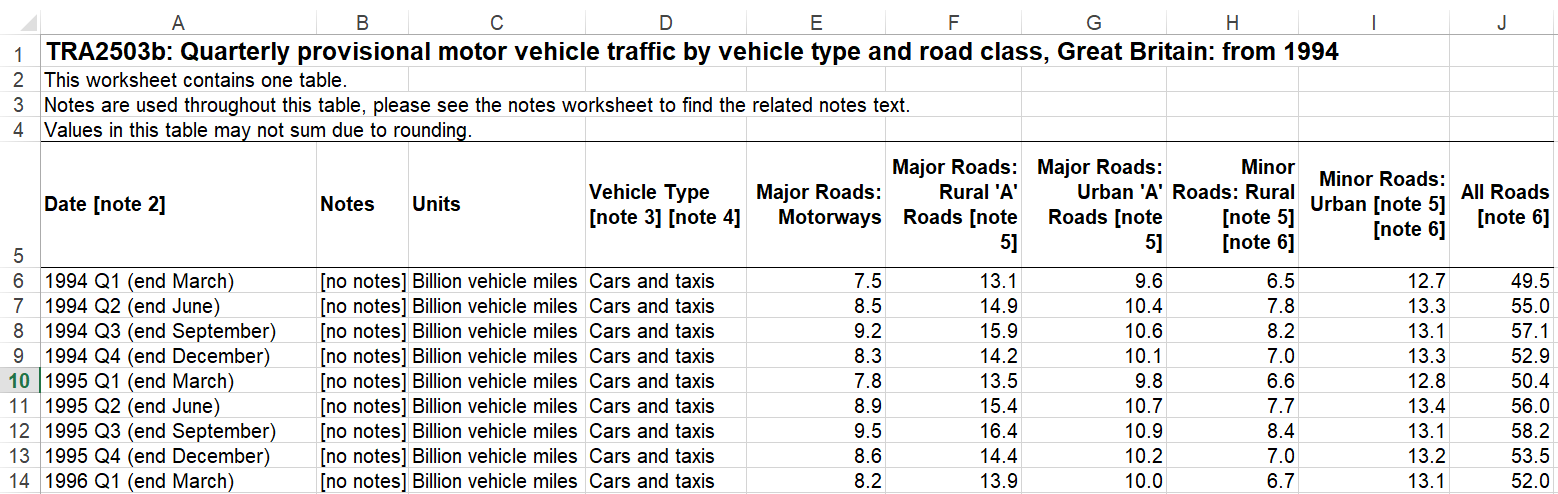
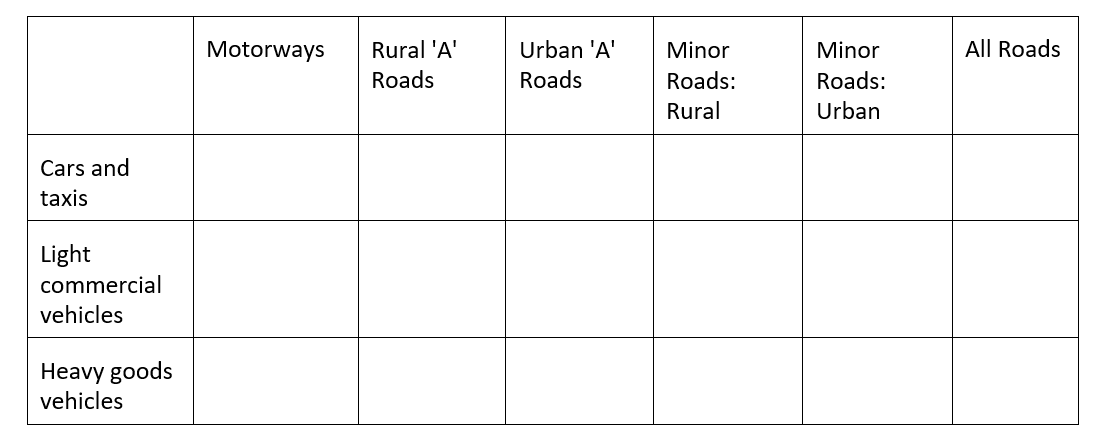
The spreadsheets provide data for the number of miles travelled by vehicles on roads in Britain, covering the period from 1994 to 2023. Both pages have the same layout:
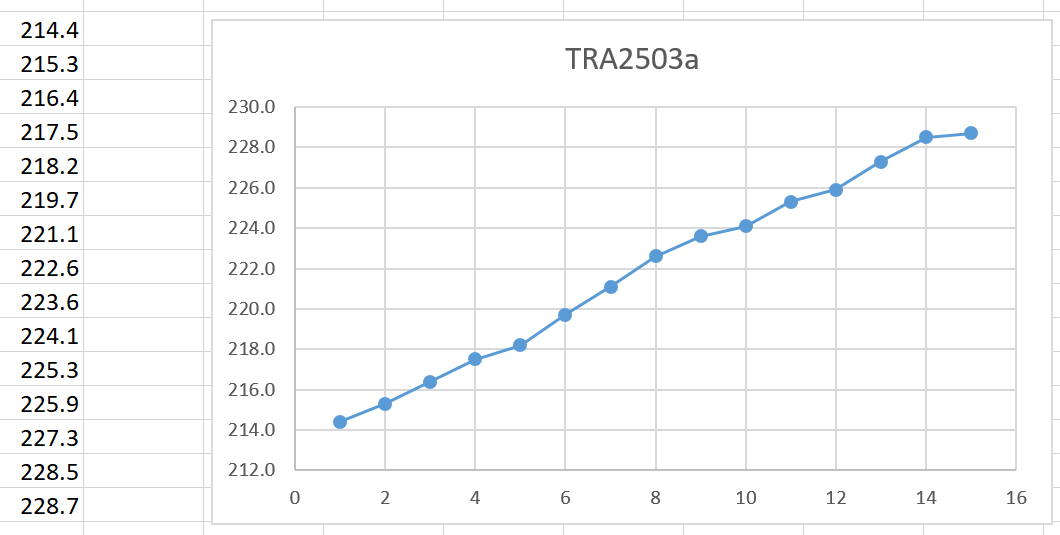
Using spreadsheet TRA2503a, copy the data from cells J6 to J20. These are the first 15 entries in the 'All Roads' column for 'Cars and taxis'. Paste the data into a new spreadsheet and produce a line graph.
The graph is a fairly smooth line, showing a steady increase from year to year in the number of car journey miles. The data has been processed to provide a rolling average for the most recent four quarters of a year. For example, as the spring quarter for 1995 is added to provide the next data point, it will replace the previous spring quarter from 1994.
Repeat the procedure with spreadsheet TRA2503b, copying the data from cells J6 to J20 and producing another line graph:
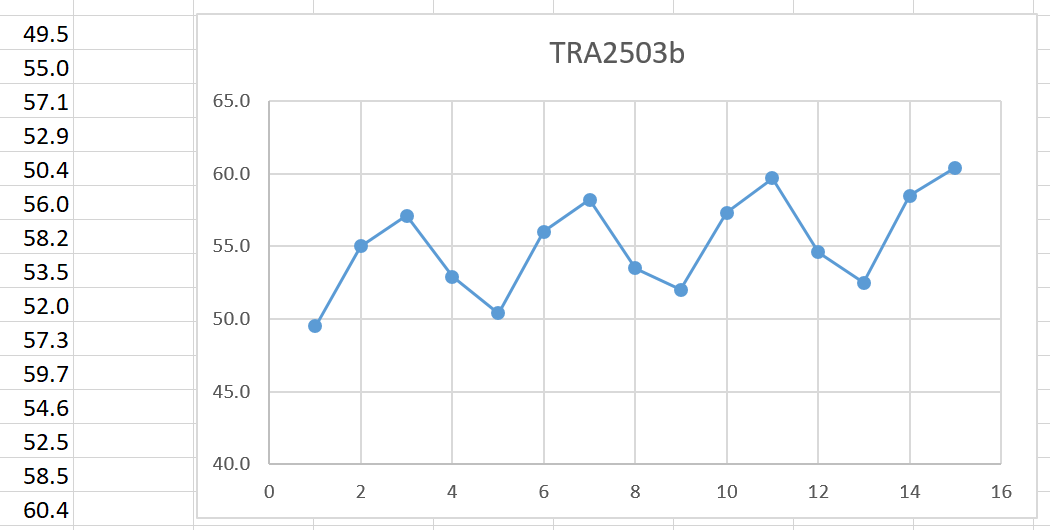
It can now be seen why a rolling average was required. This graph shows the actual car journey miles for each individual quarter of each year. The graph has a saw-tooth appearance which is due to the mileage being higher each summer and lower each winter. This obscures the underlying trend and is more difficult to interpret. For this reason, we will focus our attention on the rolling average spreadsheet in future exercises.
A file containing spreadsheet solutions for all the large data set exercises can be downloaded here:
The graphs shown above can be found on Sheet 1 of the spreadsheet workbook.

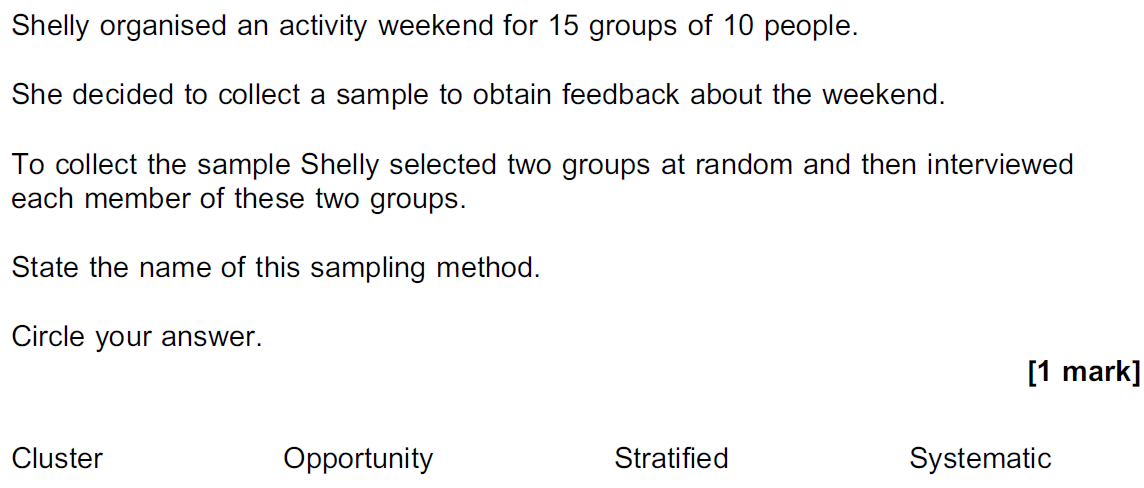
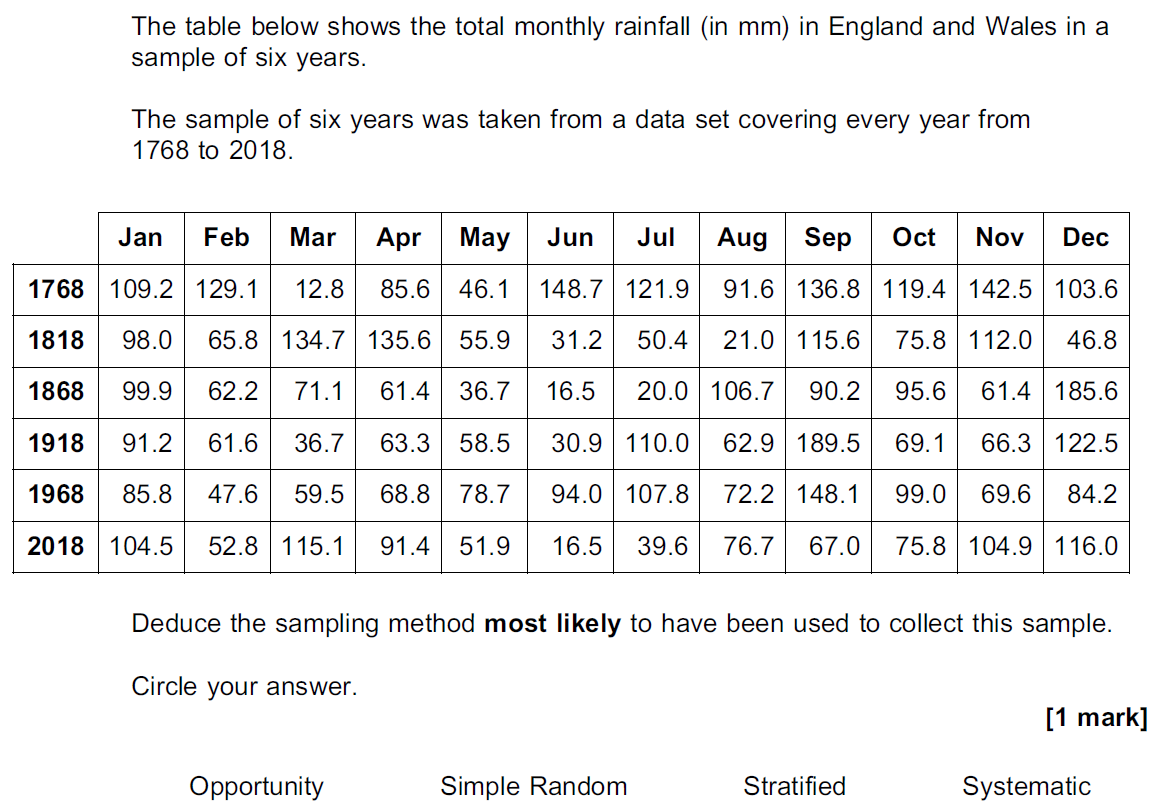
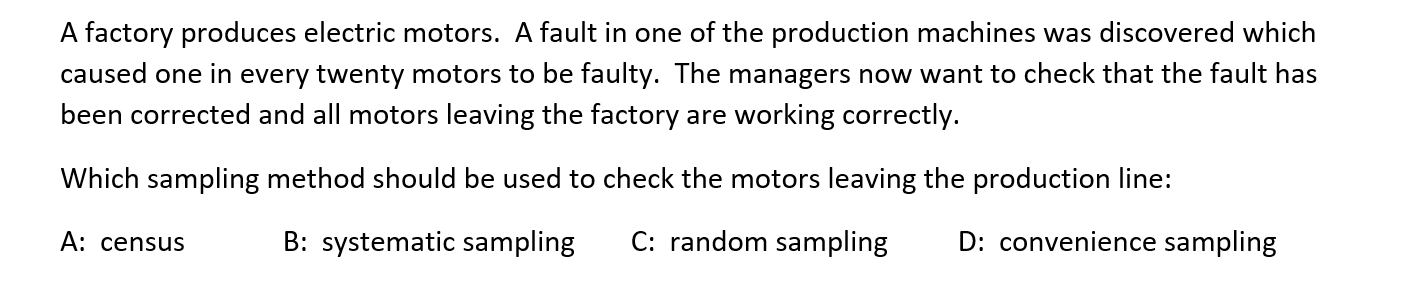
| 1.
| ||
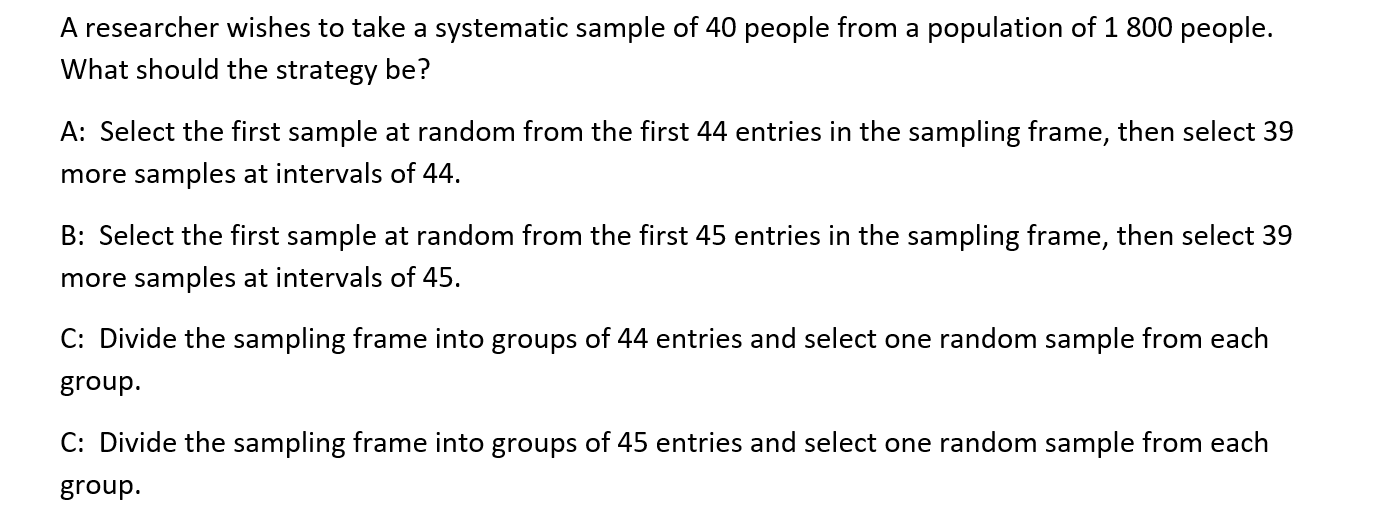
| 2.
| ||
| 3.
| ||
| 4.
| ||
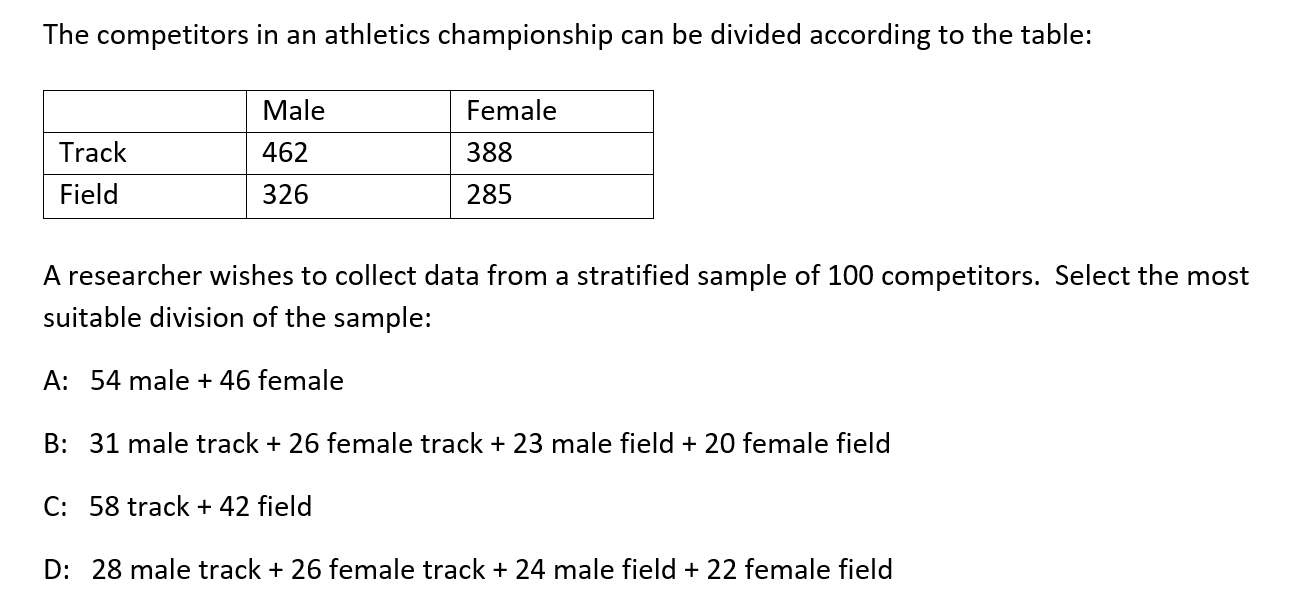
| 5.
| ||
| 6.
| ||
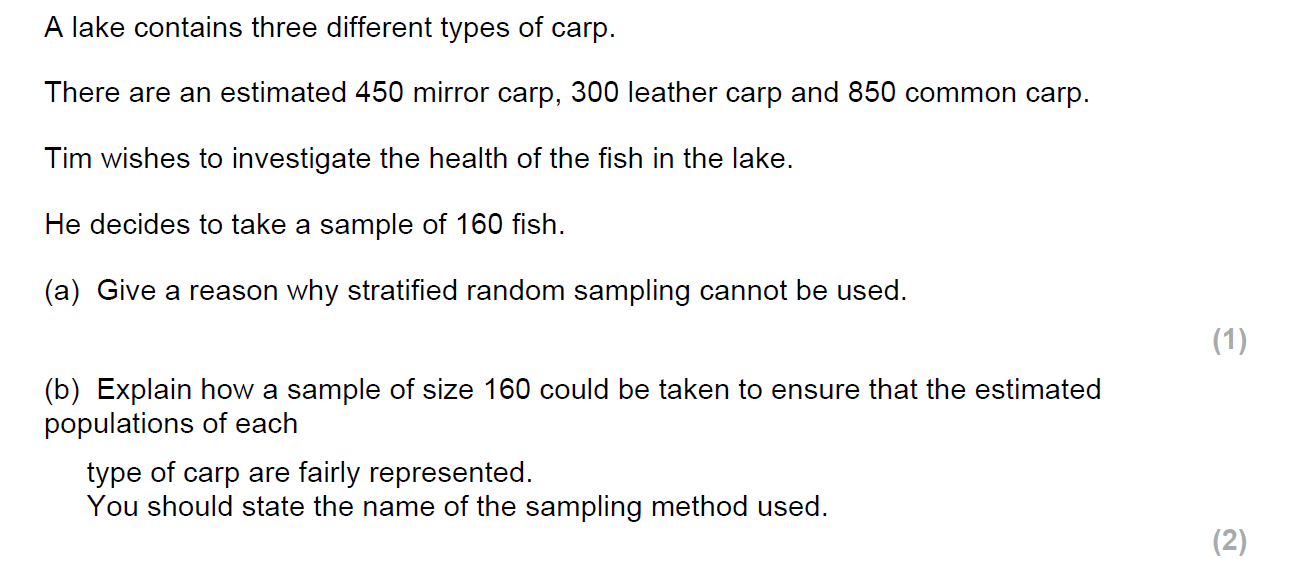
| 7.
| ||
| 8.
|

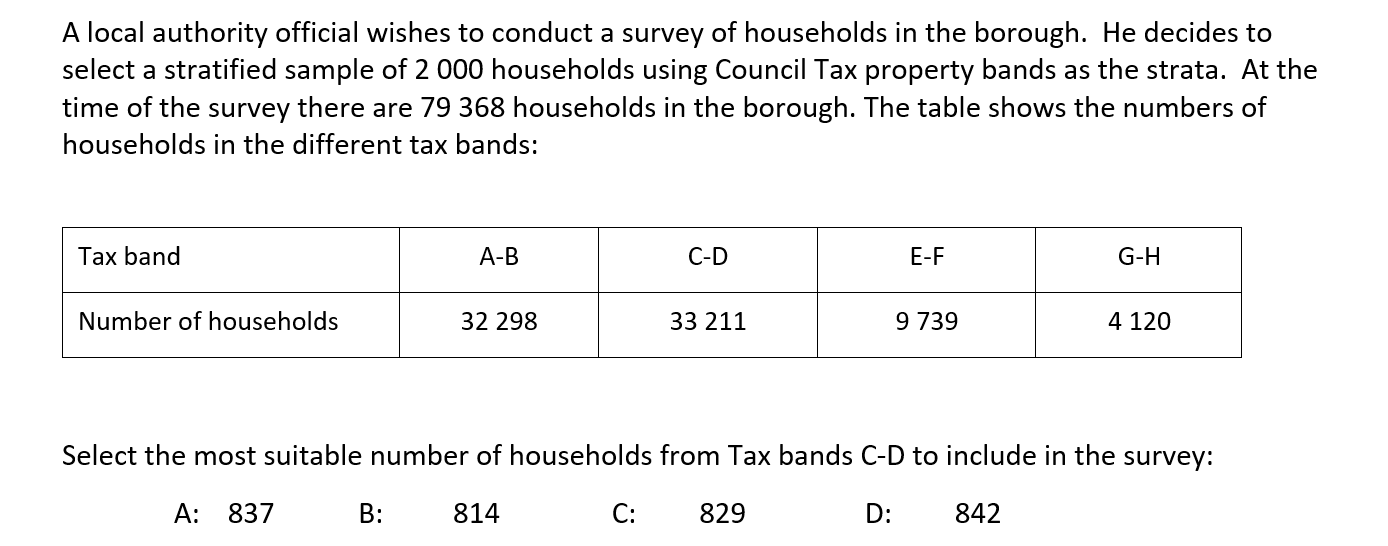
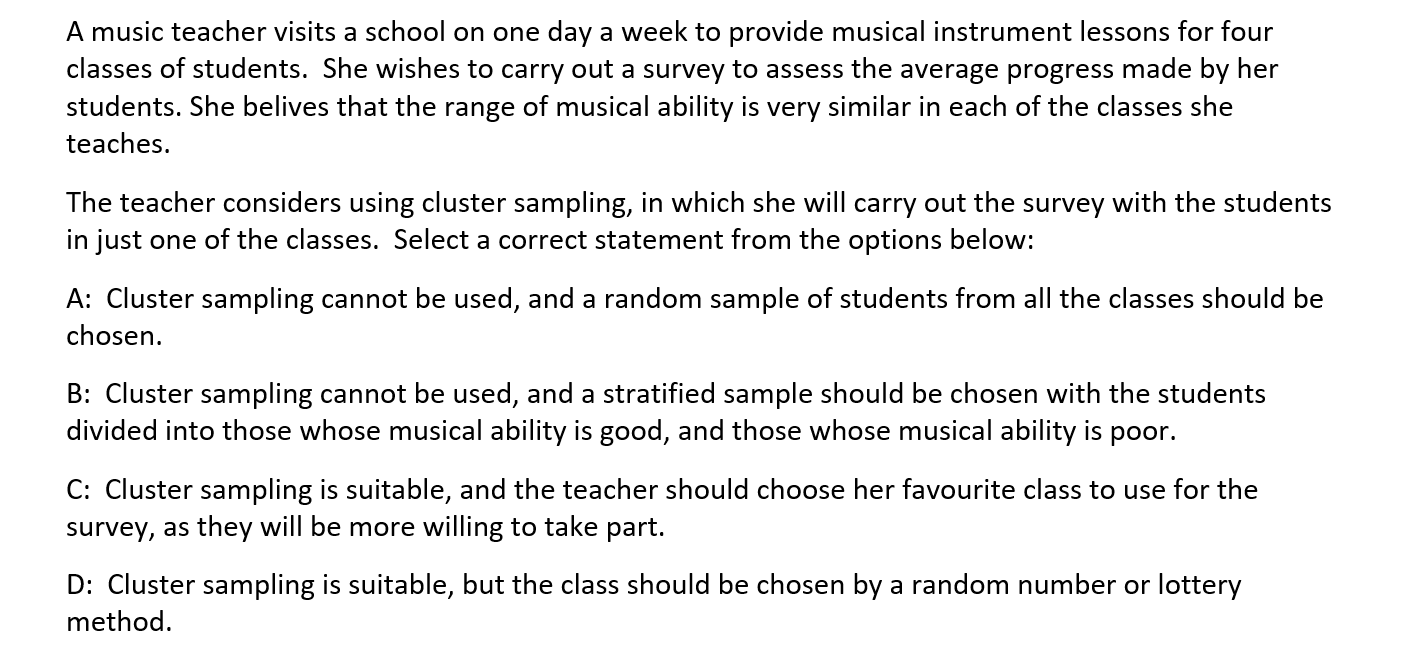

| 1.
| ||
| 2.
| ||
| 3.
| ||
| 4.
| ||
| 5.
| ||
| 6.
| ||
| 7.
| ||
| 8.
|


Summary
| All information, questions and soutions for the session may be downloaded as a PDF document. |

|